Amorphous Solid Dispersion Tablet
Assessment of API Recrystallization and Phase Distribution

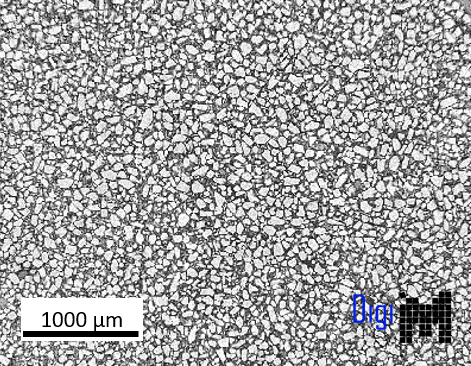
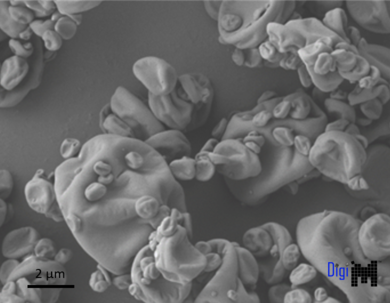
One approach to improve the solubility and bioavailability of poorly soluble drugs is to formulate the API in an amorphous state as an amorphous solid dispersion (ASD). Manufacturing of ASD based drug products involves complex mechanical and thermal transformations necessary to render the API in a kinetically stabilized amorphous state. However, detecting and monitoring crystallization, either from residual crystalline API or crystallization of amorphous API, is extremely important in assessing the effectiveness of the formulation design and process.
Based on the qualitative insight obtained from two-dimensional correlative imaging techniques, this work quantified API crystallinity using 3D X-Ray Micro-Computed Tomography (Micro-CT).

Three modeled tablet samples composed of 20% indomethacin in copovidone (PVPVA) with similar drug loading and different levels of crystallinity were imaged with various resolutions and contrast techniques. The massive amount of image data was processed with an artificial intelligence-based image segmentation engine. A suite of quantitative matrices was computed for not only the ASD domains and crystal API particles, but also pore space and pure polymer domains.
The data collected through this study can provide insight into the effectiveness of rendering the API in an amorphous state as well as the kinetic stabilization of the formulation. The data also has the potential to predict drug release performance by combining these models with image-based computational physics, to measure effective diffusivity coefficient, disintegration pattern, as well as various designed release behavior. Upon continued improvements, such approaches can potentially result in drug product development efficiencies with respect to development time, material costs as well as reducing the burden of animal and/or clinical screening studies.


Additional Case Studies

Our Expertise In Numbers
Programs Supported
Formulations Digitized
Pharmaceutical Partners

Transform Your Program with Microstructure Science
Get started with a drug product digital twin.