
Peptide drug products
Peptide Microstructure Characterization
Peptide implants, microspheres, oral tablets and lyophilized products release according to a microstructure that a certificate of analysis never shows. We image that structure in 3D, measure it, and predict release.
Peptide development teams
The Peptide Teams We Work With
Peptide application areas
Where Peptide Structure Decides Performance
Three areas across the peptide lifecycle where a product succeeds or fails on its internal structure.
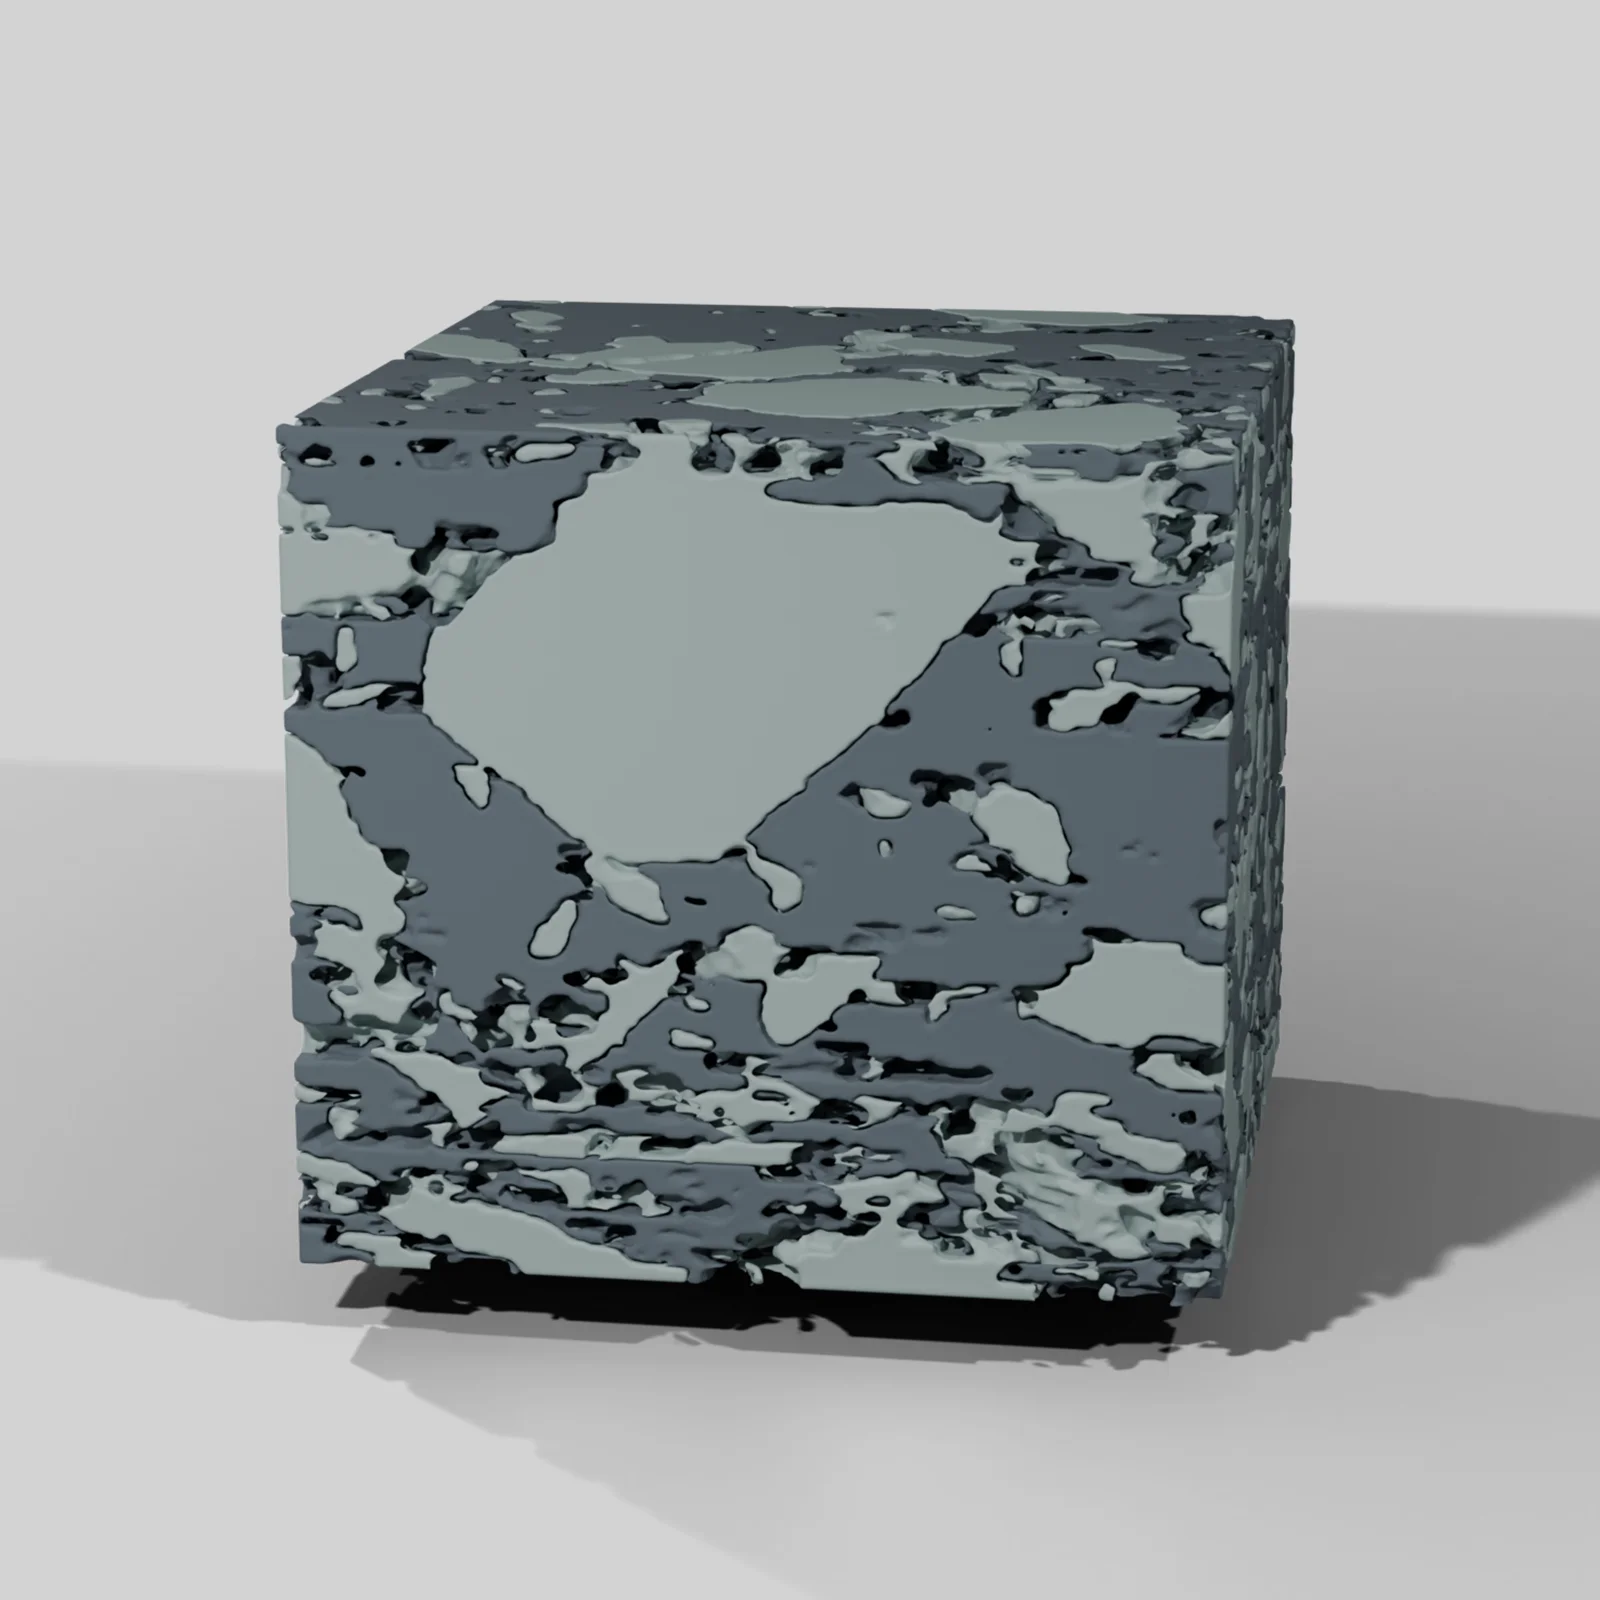
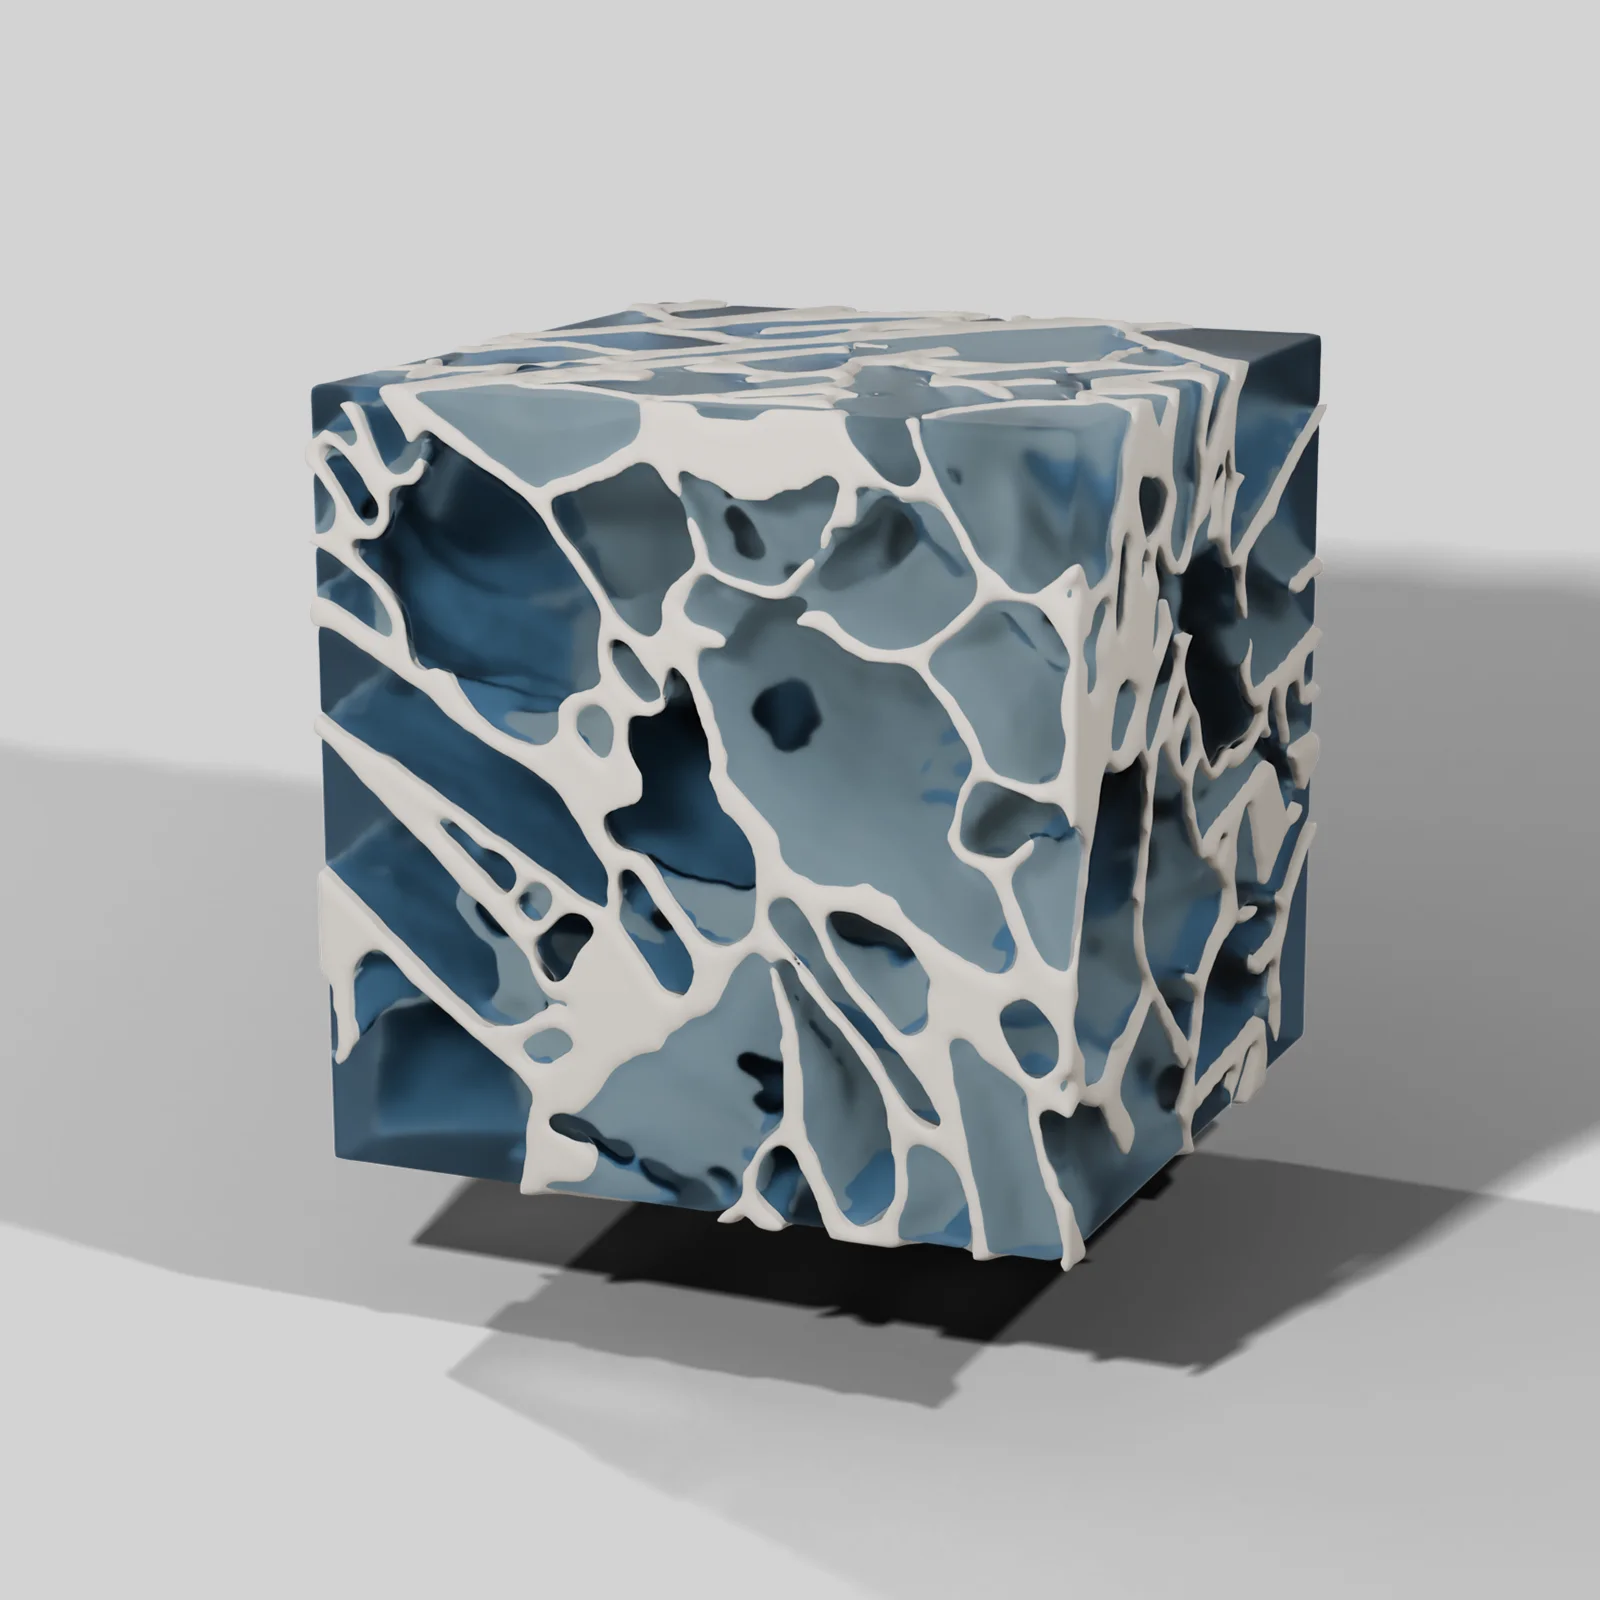
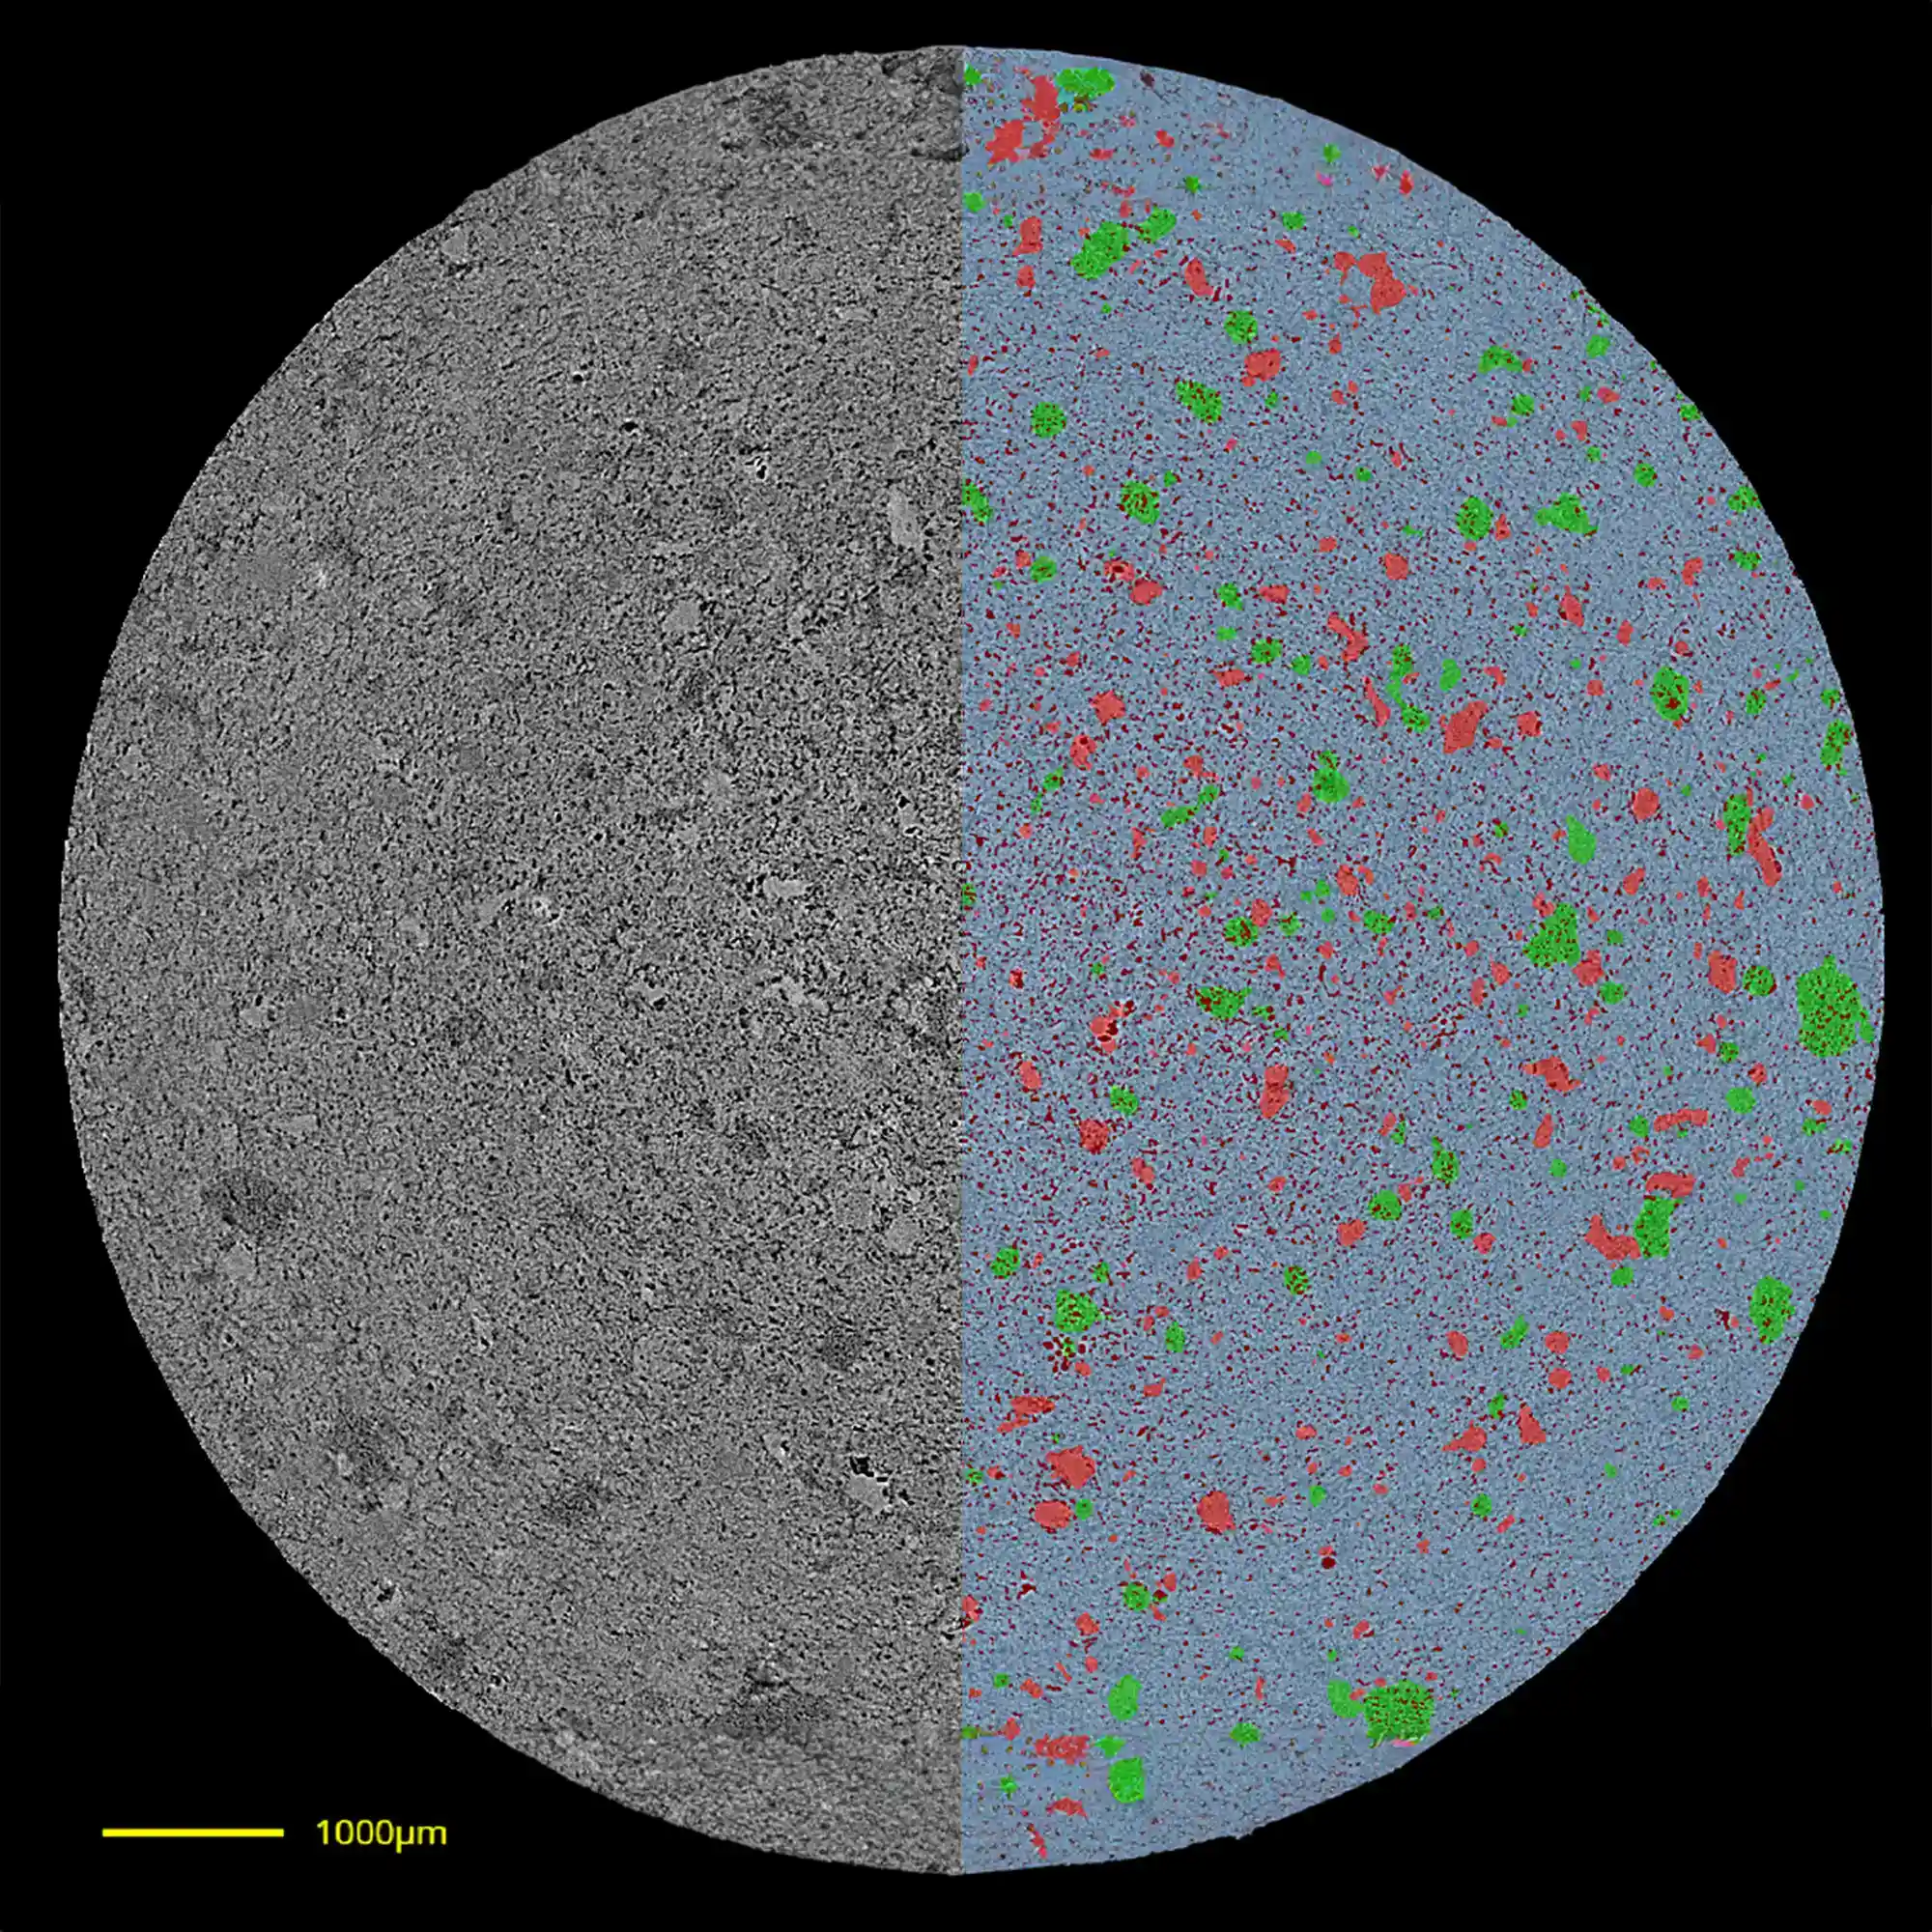
Images are representative digiM scans of each dosage form and do not show peptide products.
Implant drug loading
Same Peptide and Polymer Different Release
We imaged fifteen long-acting implants made by hot melt extrusion, all the same peptide in the same polymer. At 15% drug load the implant held zero-order release for four months, as designed. At 25%, about 78% of the dose was released within the first seven days, and at 20%, about 56%.
Percolation theory predicts burst release at 15% as well. At 15% by weight the drug takes up 17.2% of the volume, above the point where a dispersed phase links into a connected network in three dimensions. The measured drug network was 90% interconnected, consistent with that prediction.
Yet the 15% implant showed no burst. Its network was connected but poorly conductive, with a permeability 56 times lower than that of the 25% implant. Resolving this required 3D reconstruction of the implant interior and flow modeling through the drug network.
The practical percolation threshold
We define the practical percolation threshold as the drug loading at which the network begins to govern release. It does not appear on a certificate of analysis. It can be measured at day zero on implants already manufactured, months before a release study would reveal it.
Release in the first seven days
| 15% drug load | About 4%, then zero-order release over four months |
| 20% drug load | About 56% |
| 25% drug load | About 78% |
Same peptide, same polymer, hot melt extruded implants. Points are in vitro release tests. Lines are release predicted from FIB-SEM images of the as-made implants, after diffusivity and polymer degradation were calibrated against measured release. Values read from Zhang et al., Journal of Pharmaceutical Sciences, 2021, Figure 10f.
Drug volume
17.2%
of the implant volume is drug at a 15% load by weight, above the textbook percolation threshold
Network connectivity
90%
of the drug network at 15% load is interconnected, consistent with percolation theory
Permeability
56×
lower permeability than the 25% implant, which is why the 15% implant held its release
Characterization capabilities
What We Can Measure and Predict
Each study uses only the methods its question needs.
- Micro-CTNon-destructive 3D imaging at half a micron
- FIB-SEMResolution to 30 nanometers for finer structure
- AI segmentationDrug, polymer, pores and excipients each labeled through the volume
- 3D visualizationThe full volume or individual phases
- Volume percentage of each phase
- Size distribution of each phase, from pores to API particles
- Equivalent diameter
- Spatial distribution
- Porosity and pore connectivity
- Tortuosity
- Permeability of the drug network
- Practical percolation threshold
- Polymer shell thickness
- Shell to core porosity gradients
- Distance between phases, such as peptide to enhancer
- True density
- Release predictionivisLab and dissoLab, to prioritize formulations before release testing
- Q3 sameness evidenceYour measured structure set against miQ3, our database of reference listed drug microstructure metrics
- Synthetic microstructuressGAN, our generative AI that augments limited image data with realistic synthetic microstructures
Peer-reviewed research
Publications
Burst prediction
R² 0.82
between predicted and measured burst release rate over the first seven days, from day zero images of 15 implants
Prediction time
3 to 6 days
to predict a six month release test: 1 to 2 days imaging, 1 to 2 days AI image analysis, 1 to 2 days release prediction
Release profiles
25
profiles for implants designed to release over four to six months, produced in a few weeks
Zhang et al. and Nagapudi et al., Journal of Pharmaceutical Sciences, 2021
Long-acting peptide implants imaged at half a micron and again at 30 nanometers
Fifteen hot melt extruded implants. The papers measure the drug network, find the practical percolation threshold, and predict burst release from day zero images.
Read the publication →Journal of Controlled Release, 2023Thousands of PLGA microspheres per batch measured non-destructively in 3D
Eight compositionally equivalent batches. Microspheres 20 µm and larger were structurally uniform within each batch, and structural variation between batches correlated inversely with release rate.
Read the publication →Limitations
- Imaging at half a micron cannot resolve features below 1 to 2 µm, so it is not the tool for nanoscale structure.
- The authors note that imaging alone cannot fully characterize a microsphere product.
- The microsphere structure to release correlation has three exceptions among eight batches.
- The closest implant release prediction required calibrating two transport parameters against measured release data from one implant.
Microstructure CRO study
Study Workflow
Each study begins with one unit and one defined question. Every stage lists its deliverables and turnaround.
Scope call
We define the dosage form and the study question with you. Together they determine the imaging method, resolution and cost.
One call
Baseline Scan
One unit imaged, segmented and quantified, with a written assessment of whether the microstructure accounts for the observed behavior.
10 to 14 working days
Performance CRO
Release prediction, comparison against a reference, or a lyophilization cycle comparison across several lots or formulations.
3 to 6 weeks
A six month in vitro release test can be predicted in three to six days: one to two days of imaging, one to two days of AI image analysis, and one to two days of release prediction.
Zhang et al., Journal of Pharmaceutical Sciences, 2021
Pharmaceutical imaging software
The Software Behind Every Study
We apply these tools to active peptide programs. The same software is available for license to run in house.
segHT PLM
Detects crystalline and amorphous domains in polarized light microscopy images of the API.
→digiM I2S
Turns an image stack into segmented, quantified structure.
→sGAN
Generates realistic microstructures when imaging data is limited.
→The Difference Between Two Batches Is Inside the Dosage Form
A study can start from one unit or an existing image stack. We return the grayscale and segmented images, the measured structure of every phase and 3D visualizations for internal review.